Regional & AQM Station Maps
Envitech Ltd EnviWeb site offers two kind of maps: The first is the AQM Station map that displays regions. Clicking on any region will display the relevant Region Map (which is the second type of map available) that let the user to select stations and display Station Summary Information screen.
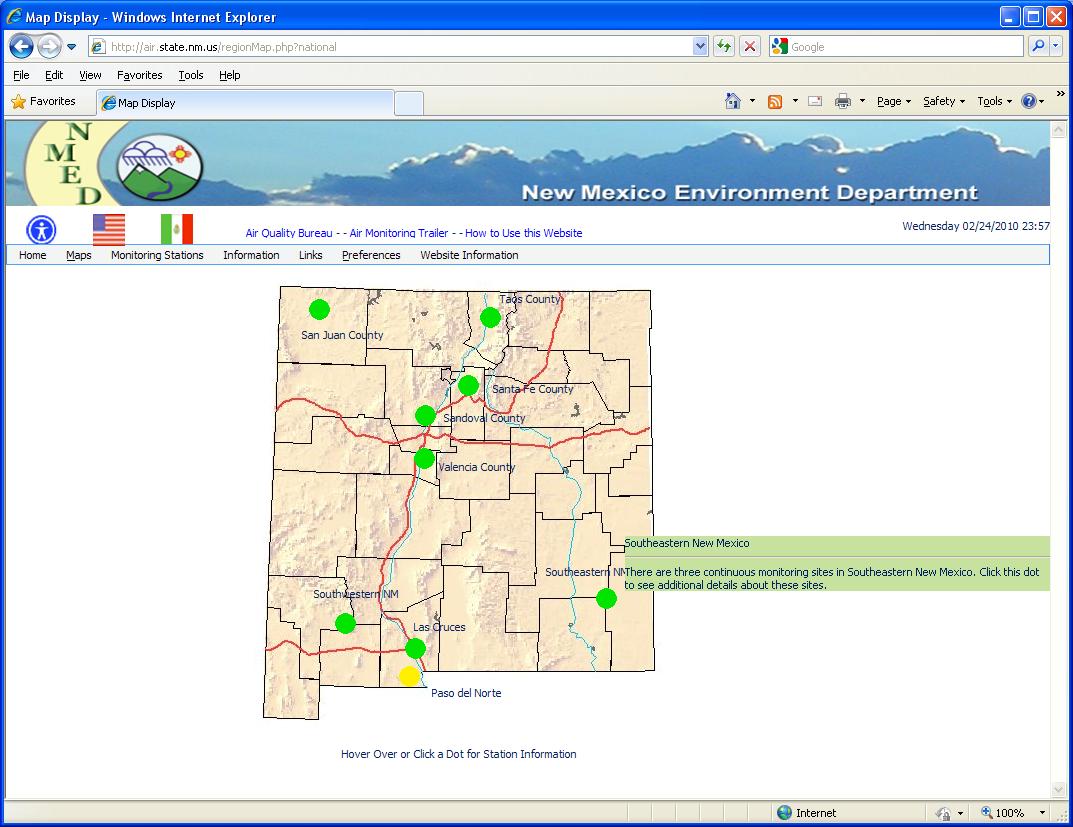
The Envitech EnviWeb site can display a map of the entire area covered by the environmental monitoring stations, The AQM Station Map is divided to different regions.
If the mouse is left above a 'hot-spot' without being clicked, a small information screen will be displayed with information regarding the region (as shown in the figure below). This information is configured by the site administrator and will be translated into the local viewing language being used, provided the site administrator has made the necessary translations.
When clicking on a region, a detailed map of that region will be displayed (see Regional Map tab).
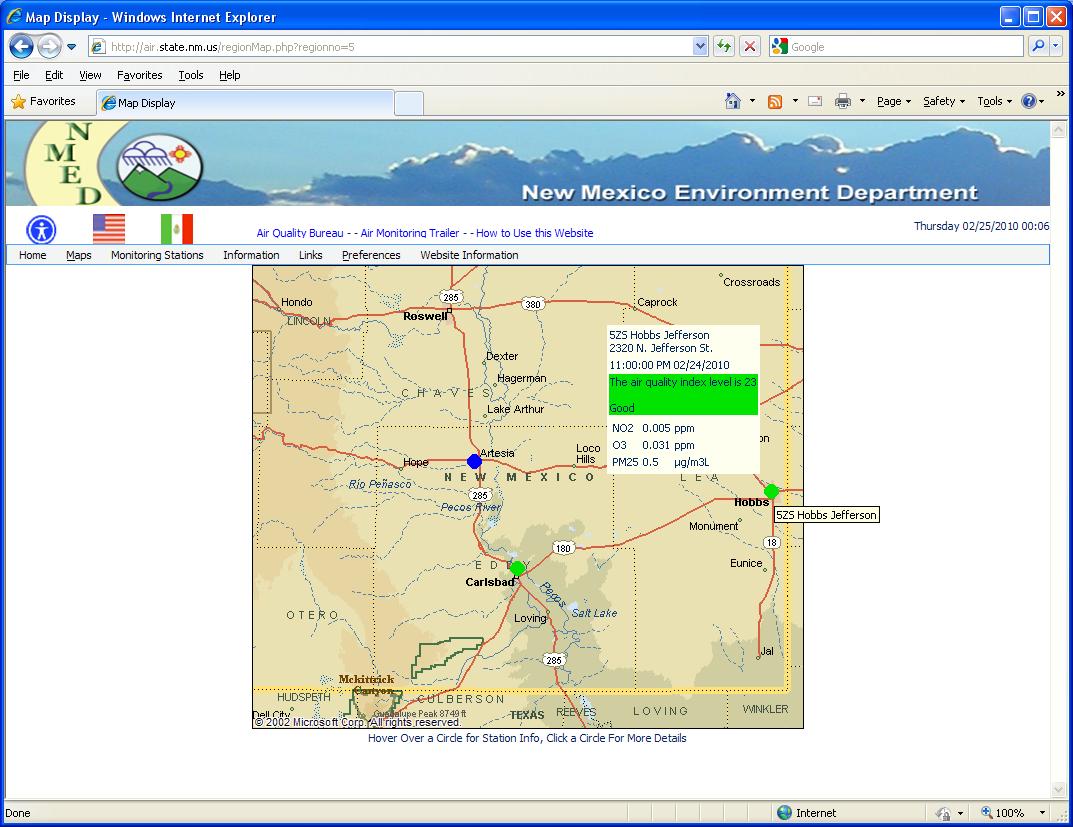
A regional map in the Envitech Ltd EnviWeb site is displayed in response to selection of a' hot-spot 'on the national map
display. A regional map has a number of 'hot-spot' areas which represent any combination of cities or stations - the precise combination of cities or stations which are shown is configured by the site administrator.
By clicking on a station 'hot-spot', the display will then switch to an information display for the selected station.
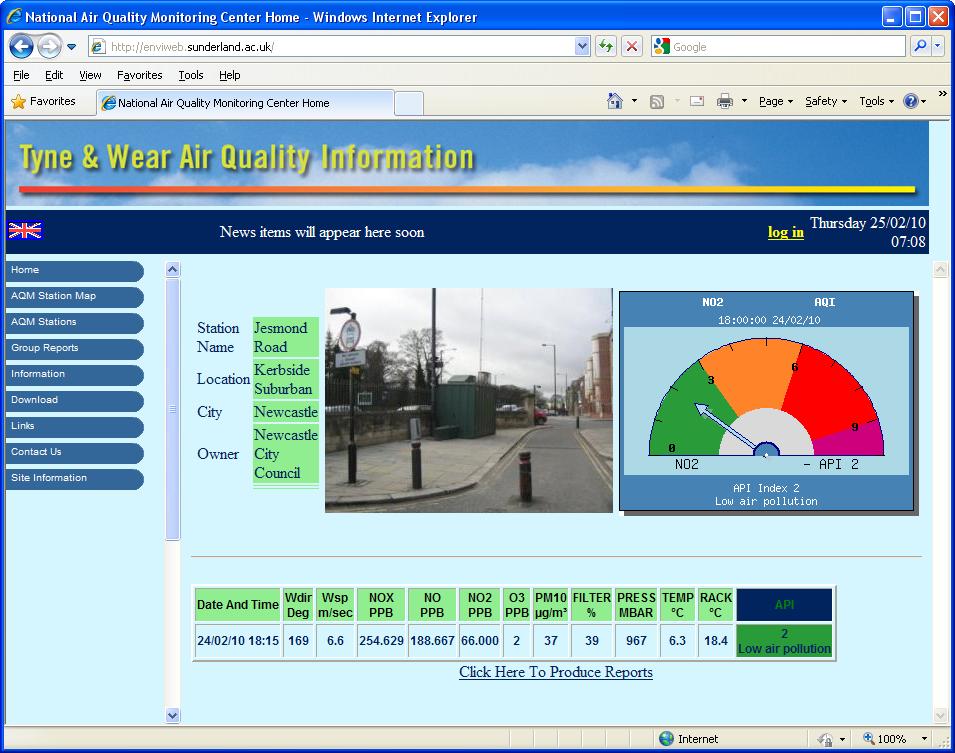
When a station is selected, either from the map display or from the menu system, a summary screen is shown with basic information regarding the monitoring station and the latest available data for each monitored channel.
In order to create reports from the station, mouse click on the report creation hyperlink located on the bottom of the Station Summary Information page.