Dynamic Displays
Envitech Ltd Envista Web site offers three dynamic display available, each let the users to see air monitoring data from AQM/ CEM sites, in graphic, textual and visual presentations. Click on each tab to obtain further information about each dynamic display option.
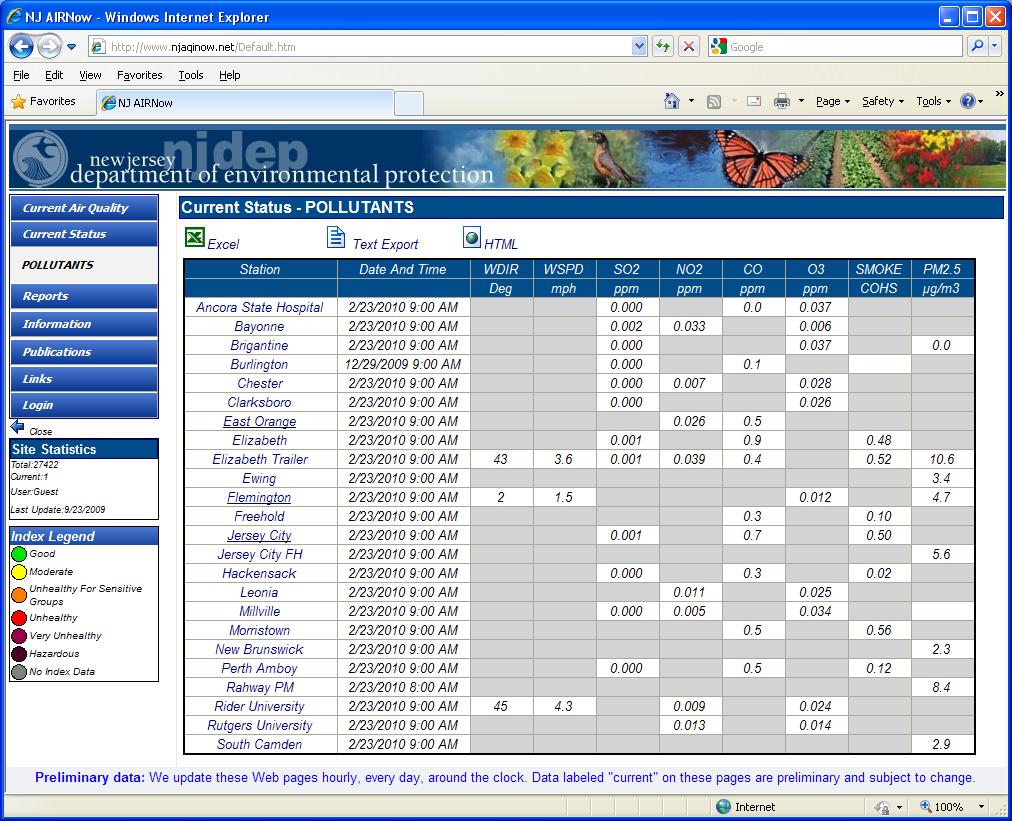
Dynamic Table is a utility of the Envitech Ltd EnvitaWeb site that display current air monitoring data for monitors from one or more AQM/CEM stations in tabular format. The Web administrator can set up to 20 tables. Direct Station Board access by pressing the station name.
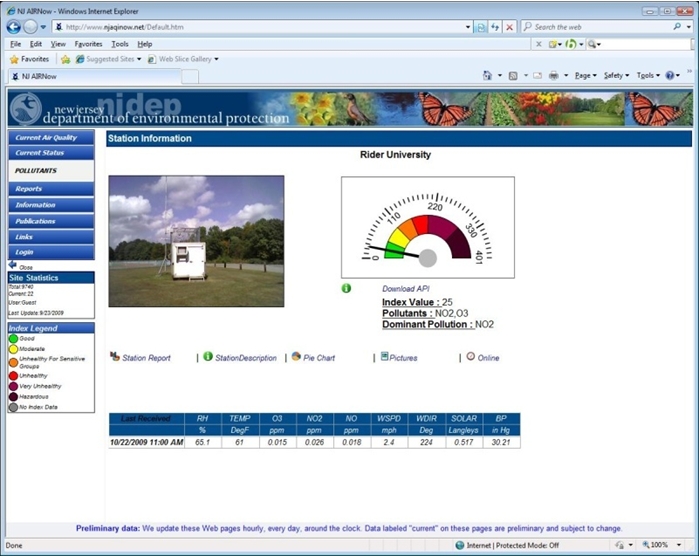
If the mouse is left above a 'Index-spot' without being clicked, a small information screen will be displayed with information regarding the AQM/ CEM site. By clicking on a station 'Index-spot', the display will then switch to an site board for the selected air monitoring station. This board including various information about the station and its air monitoring data and display few buttons that will lead to another presentations. You can reach through this screen to online view of station's data, picture gallery of the station itself, station tabular and graphic report and last received table.
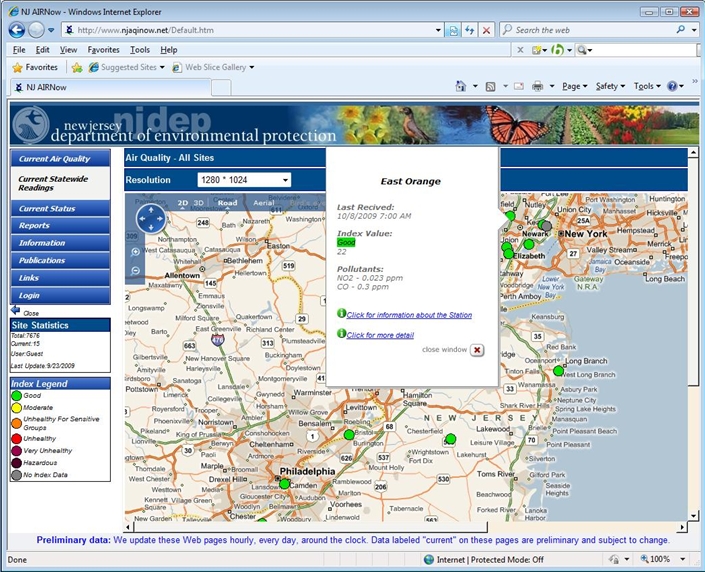
A GIS multi Vector (SHP) map can be displayed of the entire area covered by the environmental monitoring stations, Point, Polygon and Line SHP file supported. The Station location layer is a Point SHP vector map. The Software support also Microsoft Virtual Earth as Map Back ground.
This GIS interface is also used for Navigation purpose and current AQI status. The Surfer can move the map zoom in and out and change map resolution.
The stations display on the map can be shown by various symbols, that reflect wind, air quality index dots or bars. The user can move the mouse on top of each station and the station card will pop-up, letting to open station information screen with various utilities of data management including dynamic data displays.
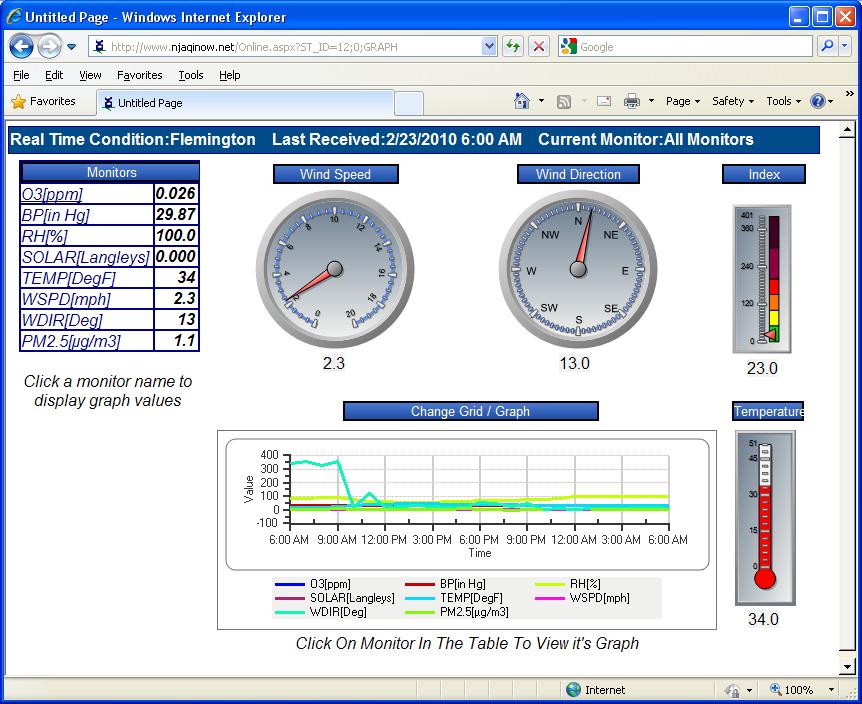
One of the options from the station board screen is to click on the Online tab and see the last received data for the station's monitors in a visual display. It reflects some tables, graphs, panels and information about the station that updates every few seconds and including gauges, clocks and more graphical objects.